Be kind to your users-use a map application
https://e-docs.geo-leo.de/map
“The application of GIS is limited only by the imagination of those who use it”. ~ Jack Dangermond , ESRI
Just because you have some geographical data doesn’t mean you should always map it but often the usage of data visualization with an interactive web map application can bring benefits to your project.
Map visualization helps to reduce the degree of abstraction and supports communication and sense-making (a.k.a. data analysis) of your data. Furthermore, an interactive map with functionality like geometry search, layer control, displaying additional information related to geometries, etc. makes the search process and data access more efficient and eases data exploration. An interactive map would also allow vіеwіng, questioning, undеrѕtаndіng, visualizing аnd іntеrрrеtіng the dаtа into numbеr оf wауѕ. Integrated spatio-temporal analysis functionality can support this possibility of data interpretation.
Unfortunately we are not yet in a technological age where it is common that you can look at textual coordinate data and your Augmented Reality contact lenses automatically display the according map visualization to you.
So, we are responsible that the geographic information, we want to present to our users, is adequate to human perception, and it should be a goal of every project that data exploration and analysis is eased as much as possible.
Luckily there are a bunch of web mapping libraries and services available that supports us in this mission. The libraries can be integrated into our different kinds of applications and can be adapted to our specific project needs.
Examples:
Which one is the “best” framework to choose for your project depends on the provided geodata as well as the specific application and project requirements. The choice of an adequate type of map visualization is also in big parts purpose-driven. Each map type has its own strengths. The different types can be combined with each other and developed further to produce new types of maps.
Examples:
To illustrate how an interactive map visualization can be a benefit for the representation of geodata, I want to point to a current project development at SUB:
The FID GEO provides a list of geological maps (1:25000) – online availability listed (present and potential) as a PDF.
This list contains over 900 map sheets of the Prussian geological map 1 : 25 000 that can be found online (free download), as well as more than 600 map sheets that can be digitized by FID GEO free of charge, once a notice of demand is received.
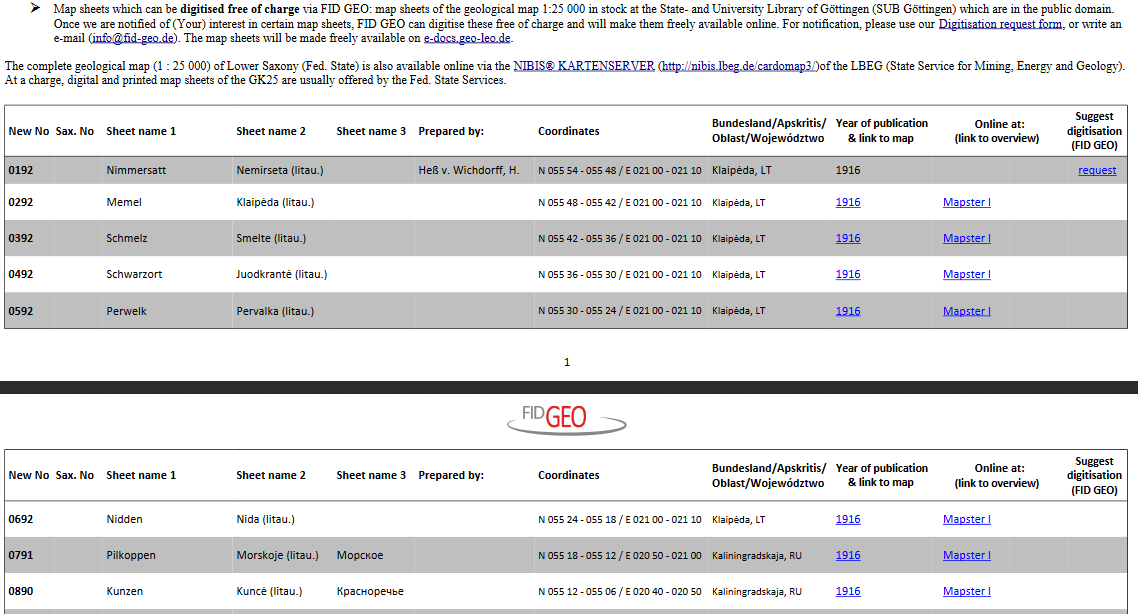
OK, you can use the text search and try to find a location by name and you can visit the provided links of the maps that are already digitized. But e.g. if you search for a region that is part of a map, but not directly named, it can be cumbersome to find the right map. Additionally, the map extent can only be checked visually by visiting the link to the digital copy. Besides this approach is time-consuming, the isolated view of a map can be also not the best solution for you if the region of your interest is located in the transition area of different maps. If you are interested into a map that isn’t already digitized you only have coordinates provided without visualization.
In this case an interactive map application improves the data representation and eases data access:
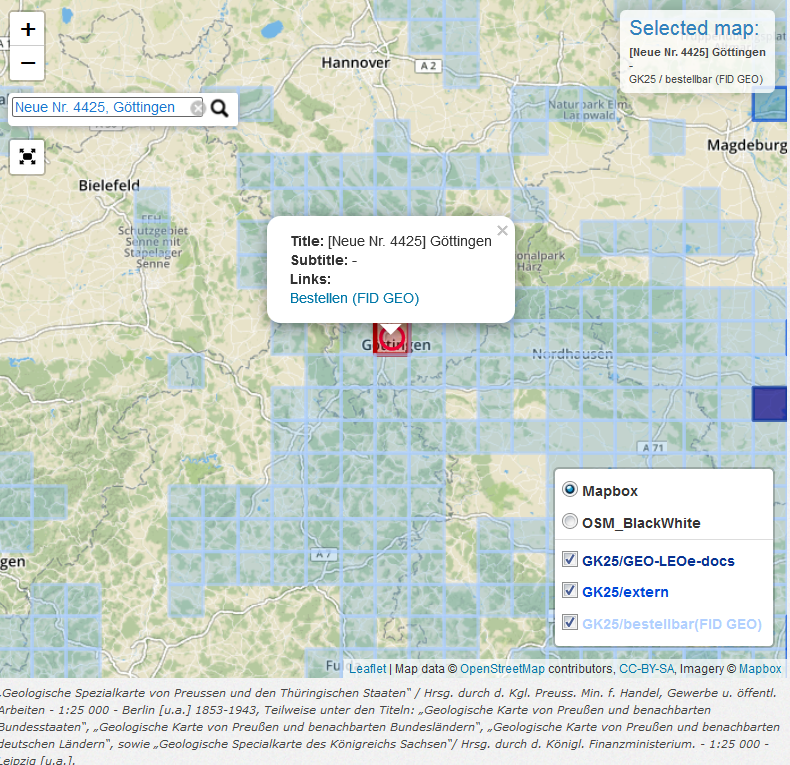
Current features of the application:
- Dynamic info box
- Enlarged view mode via button
- Selection of the map extent with hover highlighting
- Display of the attributes with links to the digital copies or the FID GEO order form by clicking on the map geometry
- Selected visualization of background map and geological map categories
- Search via button with magnifying glass symbol (supports location name e.g. “Göttingen” and map No. like “4425”)
The solution is implemented with Leaflet and additional plugins like leaflet-search that were adapted for this use case. The geological map data is underlying as GeoJSON.
The application is available: https://e-docs.geo-leo.de/map
